차밍이
[파이썬/데이터분석] LendingClub 원금 상환 여부 예측하기(2) 시각화 소스코드 본문
※ 주의 ※
본 게시글은 아래의 게시글에서 설명한 EDA와 시각화 과정에서 사용된 소스코드를 첨부한 게시글입니다. LendingClub EDA와 시각화에 대한 설명이나 상태를 확인하고 싶으시면 아래 링크를 통해서 이전 게시글을 확이 하시면 됩니다.
[파이썬/데이터 사이언스] - [파이썬 데이터 분석] LendingClub 원금 상환 여부 예측하기(1) : EDA와 데이터 시각화
[파이썬 데이터분석] LendingClub 원금 상환 여부 예측하기(1) : EDA와 데이터 시각화
이번 포스팅을 시작으로 Lending Club의 데이터를 활용해 파이썬 데이터 분석을 진행해볼 예정입니다. 파이썬이 데이터 분석하기에 좋고 강력한 library들도 많이 있습니다. 현재 4차 산업 양성과정의 빅데이터 AI..
chancoding.tistory.com
데이터셋은 Kaggle의 LendingClub Dataset입니다.
Intro
LendingClub 데이터셋을 사용해서 원금 상환 여부를 예측하는 프로젝트를 진행하고 있습니다. 게시글 첫 번째 과정에서 EDA와 데이터 시각화를 진행하였습니다. EDA와 시각화 과정에서 발생한 파이썬 코드를 이번 게시글을 통해서 공유하도록 하겠습니다.
사용된 라이브러리
전체 소스코드에서 시각화에 대한 부분이므로 전체 라이브러리가 나타나 있습니다.
데이터 프레임에서 바로 plot을 사용하여 데이터를 시간화한 부분도 있고 Seaborn 라이브러리 sns를 사용해서 그래프를 그린 케이스도 있습니다.
import pandas as pd
import seaborn as sns
import numpy as np
import matplotlib.pyplot as plt
% matplotlib inline

# Plotly visualizations
import chart_studio.plotly as py
from plotly import tools
import plotly.figure_factory as ff
import plotly.graph_objs as go
from plotly.offline import download_plotlyjs, init_notebook_mode, plot, iplot
init_notebook_mode(connected=True)

# For oversampling Library (Dealing with Imbalanced Datasets)
from imblearn.over_sampling import SMOTE
from collections import Counter

# Other Libraries
import time

df = pd.read_csv("loan.csv", low_memory=False)

# Copy of the dataframe
df.head()
데이터 프레임의 head를 출력하여 전체적인 데이터 상태를 확인해보았습니다.
| id | member_id | loan_amnt | funded_amnt | funded_amnt_inv | term | int_rate | installment | grade | sub_grade | emp_title | emp_length | home_ownership | annual_inc | verification_status | issue_d | loan_status | pymnt_plan | url | desc | purpose | title | zip_code | addr_state | dti | delinq_2yrs | earliest_cr_line | inq_last_6mths | mths_since_last_delinq | mths_since_last_record | open_acc | pub_rec | revol_bal | revol_util | total_acc | initial_list_status | out_prncp | out_prncp_inv | total_pymnt | total_pymnt_inv | ... | pub_rec_bankruptcies | tax_liens | tot_hi_cred_lim | total_bal_ex_mort | total_bc_limit | total_il_high_credit_limit | revol_bal_joint | sec_app_earliest_cr_line | sec_app_inq_last_6mths | sec_app_mort_acc | sec_app_open_acc | sec_app_revol_util | sec_app_open_act_il | sec_app_num_rev_accts | sec_app_chargeoff_within_12_mths | sec_app_collections_12_mths_ex_med | sec_app_mths_since_last_major_derog | hardship_flag | hardship_type | hardship_reason | hardship_status | deferral_term | hardship_amount | hardship_start_date | hardship_end_date | payment_plan_start_date | hardship_length | hardship_dpd | hardship_loan_status | orig_projected_additional_accrued_interest | hardship_payoff_balance_amount | hardship_last_payment_amount | disbursement_method | debt_settlement_flag | debt_settlement_flag_date | settlement_status | settlement_date | settlement_amount | settlement_percentage | settlement_term | |
|---|---|---|---|---|---|---|---|---|---|---|---|---|---|---|---|---|---|---|---|---|---|---|---|---|---|---|---|---|---|---|---|---|---|---|---|---|---|---|---|---|---|---|---|---|---|---|---|---|---|---|---|---|---|---|---|---|---|---|---|---|---|---|---|---|---|---|---|---|---|---|---|---|---|---|---|---|---|---|---|---|---|
| 0 | NaN | NaN | 2500 | 2500 | 2500.0 | 36 months | 13.56 | 84.92 | C | C1 | Chef | 10+ years | RENT | 55000.0 | Not Verified | Dec-2018 | Current | n | NaN | NaN | debt_consolidation | Debt consolidation | 109xx | NY | 18.24 | 0.0 | Apr-2001 | 1.0 | NaN | 45.0 | 9.0 | 1.0 | 4341 | 10.3 | 34.0 | w | 2386.02 | 2386.02 | 167.02 | 167.02 | ... | 1.0 | 0.0 | 60124.0 | 16901.0 | 36500.0 | 18124.0 | NaN | NaN | NaN | NaN | NaN | NaN | NaN | NaN | NaN | NaN | NaN | N | NaN | NaN | NaN | NaN | NaN | NaN | NaN | NaN | NaN | NaN | NaN | NaN | NaN | NaN | Cash | N | NaN | NaN | NaN | NaN | NaN | NaN |
| 1 | NaN | NaN | 30000 | 30000 | 30000.0 | 60 months | 18.94 | 777.23 | D | D2 | Postmaster | 10+ years | MORTGAGE | 90000.0 | Source Verified | Dec-2018 | Current | n | NaN | NaN | debt_consolidation | Debt consolidation | 713xx | LA | 26.52 | 0.0 | Jun-1987 | 0.0 | 71.0 | 75.0 | 13.0 | 1.0 | 12315 | 24.2 | 44.0 | w | 29387.75 | 29387.75 | 1507.11 | 1507.11 | ... | 1.0 | 0.0 | 372872.0 | 99468.0 | 15000.0 | 94072.0 | NaN | NaN | NaN | NaN | NaN | NaN | NaN | NaN | NaN | NaN | NaN | N | NaN | NaN | NaN | NaN | NaN | NaN | NaN | NaN | NaN | NaN | NaN | NaN | NaN | NaN | Cash | N | NaN | NaN | NaN | NaN | NaN | NaN |
| 2 | NaN | NaN | 5000 | 5000 | 5000.0 | 36 months | 17.97 | 180.69 | D | D1 | Administrative | 6 years | MORTGAGE | 59280.0 | Source Verified | Dec-2018 | Current | n | NaN | NaN | debt_consolidation | Debt consolidation | 490xx | MI | 10.51 | 0.0 | Apr-2011 | 0.0 | NaN | NaN | 8.0 | 0.0 | 4599 | 19.1 | 13.0 | w | 4787.21 | 4787.21 | 353.89 | 353.89 | ... | 0.0 | 0.0 | 136927.0 | 11749.0 | 13800.0 | 10000.0 | NaN | NaN | NaN | NaN | NaN | NaN | NaN | NaN | NaN | NaN | NaN | N | NaN | NaN | NaN | NaN | NaN | NaN | NaN | NaN | NaN | NaN | NaN | NaN | NaN | NaN | Cash | N | NaN | NaN | NaN | NaN | NaN | NaN |
| 3 | NaN | NaN | 4000 | 4000 | 4000.0 | 36 months | 18.94 | 146.51 | D | D2 | IT Supervisor | 10+ years | MORTGAGE | 92000.0 | Source Verified | Dec-2018 | Current | n | NaN | NaN | debt_consolidation | Debt consolidation | 985xx | WA | 16.74 | 0.0 | Feb-2006 | 0.0 | NaN | NaN | 10.0 | 0.0 | 5468 | 78.1 | 13.0 | w | 3831.93 | 3831.93 | 286.71 | 286.71 | ... | 0.0 | 0.0 | 385183.0 | 36151.0 | 5000.0 | 44984.0 | NaN | NaN | NaN | NaN | NaN | NaN | NaN | NaN | NaN | NaN | NaN | N | NaN | NaN | NaN | NaN | NaN | NaN | NaN | NaN | NaN | NaN | NaN | NaN | NaN | NaN | Cash | N | NaN | NaN | NaN | NaN | NaN | NaN |
| 4 | NaN | NaN | 30000 | 30000 | 30000.0 | 60 months | 16.14 | 731.78 | C | C4 | Mechanic | 10+ years | MORTGAGE | 57250.0 | Not Verified | Dec-2018 | Current | n | NaN | NaN | debt_consolidation | Debt consolidation | 212xx | MD | 26.35 | 0.0 | Dec-2000 | 0.0 | NaN | NaN | 12.0 | 0.0 | 829 | 3.6 | 26.0 | w | 29339.02 | 29339.02 | 1423.21 | 1423.21 | ... | 0.0 | 0.0 | 157548.0 | 29674.0 | 9300.0 | 32332.0 | NaN | NaN | NaN | NaN | NaN | NaN | NaN | NaN | NaN | NaN | NaN | N | NaN | NaN | NaN | NaN | NaN | NaN | NaN | NaN | NaN | NaN | NaN | NaN | NaN | NaN | Cash | N | NaN | NaN | NaN | NaN | NaN | NaN |
5 rows × 145 columns
# 데이터 상태 확인
df.info()
df.shape
(2260668, 145)
df.describe()| id | member_id | loan_amnt | funded_amnt | funded_amnt_inv | int_rate | installment | annual_inc | url | dti | delinq_2yrs | inq_last_6mths | mths_since_last_delinq | mths_since_last_record | open_acc | pub_rec | revol_bal | revol_util | total_acc | out_prncp | out_prncp_inv | total_pymnt | total_pymnt_inv | total_rec_prncp | total_rec_int | total_rec_late_fee | recoveries | collection_recovery_fee | last_pymnt_amnt | collections_12_mths_ex_med | mths_since_last_major_derog | policy_code | annual_inc_joint | dti_joint | acc_now_delinq | tot_coll_amt | tot_cur_bal | open_acc_6m | open_act_il | open_il_12m | ... | num_actv_rev_tl | num_bc_sats | num_bc_tl | num_il_tl | num_op_rev_tl | num_rev_accts | num_rev_tl_bal_gt_0 | num_sats | num_tl_120dpd_2m | num_tl_30dpd | num_tl_90g_dpd_24m | num_tl_op_past_12m | pct_tl_nvr_dlq | percent_bc_gt_75 | pub_rec_bankruptcies | tax_liens | tot_hi_cred_lim | total_bal_ex_mort | total_bc_limit | total_il_high_credit_limit | revol_bal_joint | sec_app_inq_last_6mths | sec_app_mort_acc | sec_app_open_acc | sec_app_revol_util | sec_app_open_act_il | sec_app_num_rev_accts | sec_app_chargeoff_within_12_mths | sec_app_collections_12_mths_ex_med | sec_app_mths_since_last_major_derog | deferral_term | hardship_amount | hardship_length | hardship_dpd | orig_projected_additional_accrued_interest | hardship_payoff_balance_amount | hardship_last_payment_amount | settlement_amount | settlement_percentage | settlement_term | |
|---|---|---|---|---|---|---|---|---|---|---|---|---|---|---|---|---|---|---|---|---|---|---|---|---|---|---|---|---|---|---|---|---|---|---|---|---|---|---|---|---|---|---|---|---|---|---|---|---|---|---|---|---|---|---|---|---|---|---|---|---|---|---|---|---|---|---|---|---|---|---|---|---|---|---|---|---|---|---|---|---|---|
| count | 0.0 | 0.0 | 2.260668e+06 | 2.260668e+06 | 2.260668e+06 | 2.260668e+06 | 2.260668e+06 | 2.260664e+06 | 0.0 | 2.258957e+06 | 2.260639e+06 | 2.260638e+06 | 1.102166e+06 | 359156.000000 | 2.260639e+06 | 2.260639e+06 | 2.260668e+06 | 2.258866e+06 | 2.260639e+06 | 2.260668e+06 | 2.260668e+06 | 2.260668e+06 | 2.260668e+06 | 2.260668e+06 | 2.260668e+06 | 2.260668e+06 | 2.260668e+06 | 2.260668e+06 | 2.260668e+06 | 2.260523e+06 | 580775.000000 | 2260668.0 | 1.207100e+05 | 120706.000000 | 2.260639e+06 | 2.190392e+06 | 2.190392e+06 | 1.394538e+06 | 1.394539e+06 | 1.394539e+06 | ... | 2.190392e+06 | 2.202078e+06 | 2.190392e+06 | 2.190392e+06 | 2.190392e+06 | 2.190391e+06 | 2.190392e+06 | 2.202078e+06 | 2.107011e+06 | 2.190392e+06 | 2.190392e+06 | 2.190392e+06 | 2.190237e+06 | 2.185289e+06 | 2.259303e+06 | 2.260563e+06 | 2.190392e+06 | 2.210638e+06 | 2.210638e+06 | 2.190392e+06 | 1.080200e+05 | 108021.000000 | 108021.000000 | 108021.000000 | 106184.000000 | 108021.000000 | 108021.000000 | 108021.000000 | 108021.000000 | 35942.000000 | 10613.0 | 10613.000000 | 10613.0 | 10613.000000 | 8426.000000 | 10613.000000 | 10613.000000 | 33056.000000 | 33056.000000 | 33056.000000 |
| mean | NaN | NaN | 1.504693e+04 | 1.504166e+04 | 1.502344e+04 | 1.309291e+01 | 4.458076e+02 | 7.799243e+04 | NaN | 1.882420e+01 | 3.068792e-01 | 5.768354e-01 | 3.454092e+01 | 72.312842 | 1.161240e+01 | 1.975278e-01 | 1.665846e+04 | 5.033770e+01 | 2.416255e+01 | 4.446293e+03 | 4.445295e+03 | 1.182403e+04 | 1.180594e+04 | 9.300142e+03 | 2.386352e+03 | 1.462469e+00 | 1.360740e+02 | 2.259328e+01 | 3.364015e+03 | 1.814580e-02 | 44.164220 | 1.0 | 1.236246e+05 | 19.251817 | 4.147942e-03 | 2.327317e+02 | 1.424922e+05 | 9.344199e-01 | 2.779407e+00 | 6.764314e-01 | ... | 5.629468e+00 | 4.774183e+00 | 7.726402e+00 | 8.413439e+00 | 8.246523e+00 | 1.400463e+01 | 5.577951e+00 | 1.162813e+01 | 6.373958e-04 | 2.813652e-03 | 8.293767e-02 | 2.076755e+00 | 9.411458e+01 | 4.243513e+01 | 1.281935e-01 | 4.677109e-02 | 1.782428e+05 | 5.102294e+04 | 2.319377e+04 | 4.373201e+04 | 3.361728e+04 | 0.633256 | 1.538997 | 11.469455 | 58.169101 | 3.010554 | 12.533072 | 0.046352 | 0.077568 | 36.937928 | 3.0 | 155.006696 | 3.0 | 13.686422 | 454.840802 | 11628.036442 | 193.606331 | 5030.606922 | 47.775600 | 13.148596 |
| std | NaN | NaN | 9.190245e+03 | 9.188413e+03 | 9.192332e+03 | 4.832114e+00 | 2.671737e+02 | 1.126962e+05 | NaN | 1.418333e+01 | 8.672303e-01 | 8.859632e-01 | 2.190047e+01 | 26.464094 | 5.640861e+00 | 5.705150e-01 | 2.294831e+04 | 2.471307e+01 | 1.198753e+01 | 7.547612e+03 | 7.546657e+03 | 9.889599e+03 | 9.884835e+03 | 8.304886e+03 | 2.663086e+03 | 1.150210e+01 | 7.258317e+02 | 1.271114e+02 | 5.971757e+03 | 1.508131e-01 | 21.533121 | 0.0 | 7.416135e+04 | 7.822086 | 6.961656e-02 | 8.518462e+03 | 1.606926e+05 | 1.140700e+00 | 3.000784e+00 | 9.256354e-01 | ... | 3.382874e+00 | 3.037921e+00 | 4.701430e+00 | 7.359114e+00 | 4.683928e+00 | 8.038868e+00 | 3.293434e+00 | 5.644027e+00 | 2.710643e-02 | 5.616522e-02 | 4.935732e-01 | 1.830711e+00 | 9.036140e+00 | 3.621616e+01 | 3.646130e-01 | 3.775338e-01 | 1.815748e+05 | 4.991124e+04 | 2.300656e+04 | 4.507298e+04 | 2.815387e+04 | 0.993401 | 1.760569 | 6.627271 | 25.548212 | 3.275893 | 8.150964 | 0.411496 | 0.407996 | 23.924584 | 0.0 | 129.113137 | 0.0 | 9.728138 | 375.830737 | 7615.161123 | 198.694368 | 3692.027842 | 7.336379 | 8.192319 |
| min | NaN | NaN | 5.000000e+02 | 5.000000e+02 | 0.000000e+00 | 5.310000e+00 | 4.930000e+00 | 0.000000e+00 | NaN | -1.000000e+00 | 0.000000e+00 | 0.000000e+00 | 0.000000e+00 | 0.000000 | 0.000000e+00 | 0.000000e+00 | 0.000000e+00 | 0.000000e+00 | 1.000000e+00 | 0.000000e+00 | 0.000000e+00 | 0.000000e+00 | 0.000000e+00 | 0.000000e+00 | 0.000000e+00 | -9.500000e-09 | 0.000000e+00 | 0.000000e+00 | 0.000000e+00 | 0.000000e+00 | 0.000000 | 1.0 | 5.693510e+03 | 0.000000 | 0.000000e+00 | 0.000000e+00 | 0.000000e+00 | 0.000000e+00 | 0.000000e+00 | 0.000000e+00 | ... | 0.000000e+00 | 0.000000e+00 | 0.000000e+00 | 0.000000e+00 | 0.000000e+00 | 0.000000e+00 | 0.000000e+00 | 0.000000e+00 | 0.000000e+00 | 0.000000e+00 | 0.000000e+00 | 0.000000e+00 | 0.000000e+00 | 0.000000e+00 | 0.000000e+00 | 0.000000e+00 | 0.000000e+00 | 0.000000e+00 | 0.000000e+00 | 0.000000e+00 | 0.000000e+00 | 0.000000 | 0.000000 | 0.000000 | 0.000000 | 0.000000 | 0.000000 | 0.000000 | 0.000000 | 0.000000 | 3.0 | 0.640000 | 3.0 | 0.000000 | 1.920000 | 55.730000 | 0.010000 | 44.210000 | 0.200000 | 0.000000 |
| 25% | NaN | NaN | 8.000000e+03 | 8.000000e+03 | 8.000000e+03 | 9.490000e+00 | 2.516500e+02 | 4.600000e+04 | NaN | 1.189000e+01 | 0.000000e+00 | 0.000000e+00 | 1.600000e+01 | 55.000000 | 8.000000e+00 | 0.000000e+00 | 5.950000e+03 | 3.150000e+01 | 1.500000e+01 | 0.000000e+00 | 0.000000e+00 | 4.272580e+03 | 4.257730e+03 | 2.846180e+03 | 6.936100e+02 | 0.000000e+00 | 0.000000e+00 | 0.000000e+00 | 3.086400e+02 | 0.000000e+00 | 27.000000 | 1.0 | 8.340000e+04 | 13.530000 | 0.000000e+00 | 0.000000e+00 | 2.909200e+04 | 0.000000e+00 | 1.000000e+00 | 0.000000e+00 | ... | 3.000000e+00 | 3.000000e+00 | 4.000000e+00 | 3.000000e+00 | 5.000000e+00 | 8.000000e+00 | 3.000000e+00 | 8.000000e+00 | 0.000000e+00 | 0.000000e+00 | 0.000000e+00 | 1.000000e+00 | 9.130000e+01 | 0.000000e+00 | 0.000000e+00 | 0.000000e+00 | 5.073100e+04 | 2.089200e+04 | 8.300000e+03 | 1.500000e+04 | 1.510675e+04 | 0.000000 | 0.000000 | 7.000000 | 39.800000 | 1.000000 | 7.000000 | 0.000000 | 0.000000 | 16.000000 | 3.0 | 59.370000 | 3.0 | 5.000000 | 174.967500 | 5628.730000 | 43.780000 | 2227.000000 | 45.000000 | 6.000000 |
| 50% | NaN | NaN | 1.290000e+04 | 1.287500e+04 | 1.280000e+04 | 1.262000e+01 | 3.779900e+02 | 6.500000e+04 | NaN | 1.784000e+01 | 0.000000e+00 | 0.000000e+00 | 3.100000e+01 | 74.000000 | 1.100000e+01 | 0.000000e+00 | 1.132400e+04 | 5.030000e+01 | 2.200000e+01 | 0.000000e+00 | 0.000000e+00 | 9.060870e+03 | 9.043080e+03 | 6.823385e+03 | 1.485280e+03 | 0.000000e+00 | 0.000000e+00 | 0.000000e+00 | 5.884700e+02 | 0.000000e+00 | 44.000000 | 1.0 | 1.100000e+05 | 18.840000 | 0.000000e+00 | 0.000000e+00 | 7.924000e+04 | 1.000000e+00 | 2.000000e+00 | 0.000000e+00 | ... | 5.000000e+00 | 4.000000e+00 | 7.000000e+00 | 6.000000e+00 | 7.000000e+00 | 1.200000e+01 | 5.000000e+00 | 1.100000e+01 | 0.000000e+00 | 0.000000e+00 | 0.000000e+00 | 2.000000e+00 | 1.000000e+02 | 3.750000e+01 | 0.000000e+00 | 0.000000e+00 | 1.142985e+05 | 3.786400e+04 | 1.630000e+04 | 3.269600e+04 | 2.651650e+04 | 0.000000 | 1.000000 | 10.000000 | 60.200000 | 2.000000 | 11.000000 | 0.000000 | 0.000000 | 36.000000 | 3.0 | 119.040000 | 3.0 | 15.000000 | 352.605000 | 10044.220000 | 132.890000 | 4172.855000 | 45.000000 | 14.000000 |
| 75% | NaN | NaN | 2.000000e+04 | 2.000000e+04 | 2.000000e+04 | 1.599000e+01 | 5.933200e+02 | 9.300000e+04 | NaN | 2.449000e+01 | 0.000000e+00 | 1.000000e+00 | 5.000000e+01 | 92.000000 | 1.400000e+01 | 0.000000e+00 | 2.024600e+04 | 6.940000e+01 | 3.100000e+01 | 6.712632e+03 | 6.710320e+03 | 1.670797e+04 | 1.668257e+04 | 1.339750e+04 | 3.052220e+03 | 0.000000e+00 | 0.000000e+00 | 0.000000e+00 | 3.534965e+03 | 0.000000e+00 | 62.000000 | 1.0 | 1.479950e+05 | 24.620000 | 0.000000e+00 | 0.000000e+00 | 2.132040e+05 | 1.000000e+00 | 3.000000e+00 | 1.000000e+00 | ... | 7.000000e+00 | 6.000000e+00 | 1.000000e+01 | 1.100000e+01 | 1.000000e+01 | 1.800000e+01 | 7.000000e+00 | 1.400000e+01 | 0.000000e+00 | 0.000000e+00 | 0.000000e+00 | 3.000000e+00 | 1.000000e+02 | 7.140000e+01 | 0.000000e+00 | 0.000000e+00 | 2.577550e+05 | 6.435000e+04 | 3.030000e+04 | 5.880425e+04 | 4.376900e+04 | 1.000000 | 2.000000 | 15.000000 | 78.600000 | 4.000000 | 17.000000 | 0.000000 | 0.000000 | 56.000000 | 3.0 | 213.260000 | 3.0 | 22.000000 | 622.792500 | 16114.940000 | 284.180000 | 6870.782500 | 50.000000 | 18.000000 |
| max | NaN | NaN | 4.000000e+04 | 4.000000e+04 | 4.000000e+04 | 3.099000e+01 | 1.719830e+03 | 1.100000e+08 | NaN | 9.990000e+02 | 5.800000e+01 | 3.300000e+01 | 2.260000e+02 | 129.000000 | 1.010000e+02 | 8.600000e+01 | 2.904836e+06 | 8.923000e+02 | 1.760000e+02 | 4.000000e+04 | 4.000000e+04 | 6.329688e+04 | 6.329688e+04 | 4.000000e+04 | 2.819250e+04 | 1.427250e+03 | 3.985955e+04 | 7.174719e+03 | 4.219205e+04 | 2.000000e+01 | 226.000000 | 1.0 | 7.874821e+06 | 69.490000 | 1.400000e+01 | 9.152545e+06 | 9.971659e+06 | 1.800000e+01 | 5.700000e+01 | 2.500000e+01 | ... | 7.200000e+01 | 7.100000e+01 | 8.600000e+01 | 1.590000e+02 | 9.100000e+01 | 1.510000e+02 | 6.500000e+01 | 1.010000e+02 | 7.000000e+00 | 4.000000e+00 | 5.800000e+01 | 3.200000e+01 | 1.000000e+02 | 1.000000e+02 | 1.200000e+01 | 8.500000e+01 | 9.999999e+06 | 3.408095e+06 | 1.569000e+06 | 2.118996e+06 | 1.110019e+06 | 6.000000 | 27.000000 | 82.000000 | 434.300000 | 43.000000 | 106.000000 | 21.000000 | 23.000000 | 185.000000 | 3.0 | 943.940000 | 3.0 | 37.000000 | 2680.890000 | 40306.410000 | 1407.860000 | 33601.000000 | 521.350000 | 181.000000 |
8 rows × 109 columns
결측치 확인
nulls = df.isnull().sum(axis=0)
nulls.sort_values().plot(kind='bar',)
<matplotlib.axes._subplots.AxesSubplot at 0x7faa9f5af828>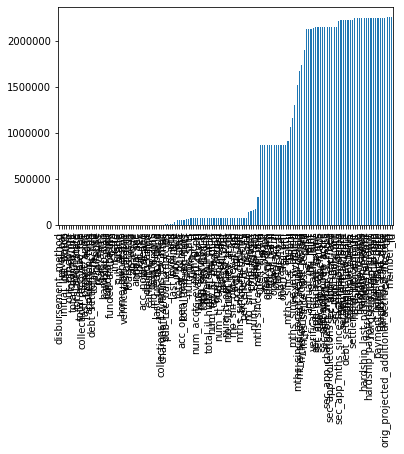
# 데이터 결측치 시각화 2
sns.barplot(data=nulls, x=nulls.index, y=nulls.values)
plt.title('The number of nulls', fontsize=20)
plt.figsize = (19,16)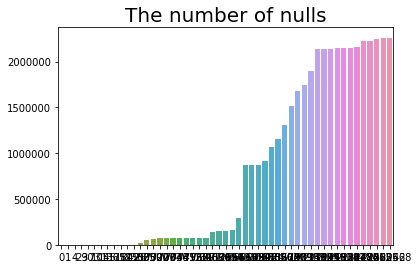
Loan Status
# Loan Status 범주 값들의 수 확인
df['loan_status'].value_counts().plot(kind='bar')
plt.title('Loan State value counts')
plt.show()
# 파이플롯으로 비율 시각화
fig = plt.figure()
df['loan_status'].value_counts().plot.pie(autopct='%1.2f%%',labels=None)
plt.title('Loan State value counts')
plt.show()

df['loan_status'].value_counts()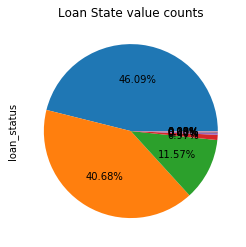
Fully Paid                                             1041952
Current                                                 919695
Charged Off                                             261655
Late (31-120 days)                                       21897
In Grace Period                                           8952
Late (16-30 days)                                         3737
Does not meet the credit policy. Status:Fully Paid        1988
Does not meet the credit policy. Status:Charged Off        761
Default                                                     31
Name: loan_status, dtype: int64
Loan Condition
# 현재 진행중인 대출과 정책위반 대출 제거
loan_status = ['Fully Paid', 'Late (31-120 days)', 'In Grace Period',
       'Charged Off', 'Late (16-30 days)', 'Default']

def needed(status):
  if status in loan_status:
    return True
  else:
    return False
df['status'] = df['loan_status'].apply(needed)
df.drop(df[df['status']==False].index, inplace=True, errors='ignore')
# 40%의 데이터가 제거되어 행 개수가 많이 줄어든 것을 확인할 수 있음
len(df)1338224# 대출 상태 분류
def loan_conditions(status):
if status == 'Fully Paid':
return 'Good'
else:
return 'Bad'
df['loan_condition'] = df['loan_status'].apply(loan_conditions)# 간단하게 Good Loan과 Bad Loan을 파이 플롯으로 확인
df['loan_condition'].value_counts().plot.pie(autopct="%1.2f%%")<matplotlib.axes._subplots.AxesSubplot at 0x7faa9d2ae668>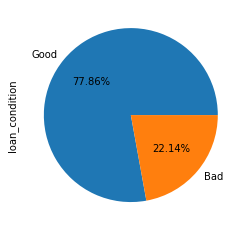
연도별 분류
# 연도 구분 열 추가
dt_series = pd.to_datetime(df['issue_d'])
df['year'] = dt_series.dt.year
# 대출 상태에 따른 시각화
f = plt.figure(figsize=(16,12))
ax1 = f.add_subplot(221)
ax2 = f.add_subplot(222)
ax3 = f.add_subplot(212)
colors = ["#3791D7", "#D72626"]
labels =["Good Loans", "Bad Loans"]
# 전체 plot에 대한 타이틀
plt.suptitle('Information on Loan Conditions', fontsize=20)
# Pie 플롯을 사용해 비율 확인
df["loan_condition"].value_counts().plot.pie(
explode=[0,0.25], autopct='%1.2f%%', ax=ax1,
shadow=True, colors=colors,labels=labels,
fontsize=12, startangle=0)
# explode : 살짝 때어지는 것
# autopct : 파이 그래프 내의 비율 수치
# ax1의 타이틀과 라벨
ax1.set_title('State of Loan', fontsize=16)
ax1.set_xlabel('% of Condition of Loans', fontsize=14)
# countpot을 사용해 상태별 개수 비교
sns.countplot('loan_condition', data=df, ax=ax2, palette=colors)
ax2.set_title('Condition of Loans', fontsize=20)
ax2.set_xticklabels(labels=labels, rotation='horizontal')
ax2.set(ylabel=('count'))
# 연도별로 대출 개수 비교
sns.barplot(x="year", y="loan_amnt", hue="loan_condition", data=df, palette=colors,
estimator=lambda y: len(y) / len(df) * 100)
# estimator 그래프에 적용할 함수
# y 값으로 표현할 값에 대한 함수 적용 가능
# mean, median 또는 자신이 원하는 것 등
ax3.set(ylabel="(%)")
ax3.set_title('Proportion of Loan Condition by Year', fontsize=20)
plt.show()
대출 금액 비교
fig = plt.figure(figsize=(12,7))
ax1 = fig.add_subplot(121)
ax2 = fig.add_subplot(122)
#대출 세부 상태에 따른 금액
df.groupby(['year','loan_status'])['loan_amnt'].sum().unstack().plot(kind='bar', figsize=(12,6), ax = ax1)
#대출 세부 상태에 따른 금액 로그스케일
df.groupby(['year','loan_status'])['loan_amnt'].sum().unstack().plot(kind='bar', figsize=(12,6), logy=True, ax = ax2)
<matplotlib.axes._subplots.AxesSubplot at 0x7faa9cb52ef0>
# 대출 세부 상태에 따른 금액
# sns를 사용해서
fig = plt.figure(figsize=(10,6))
ax1 = fig.subplots()

sns.barplot(x='year',y='loan_amnt',hue='loan_status',data=df,
            estimator = lambda y : len(y) / len(df) * 100,
            ax = ax1)
ax1.set_title('The Proprotion of Loan by Year and Status', fontsize=20)
plt.ylabel('(%)', fontsize=20)
plt.xlabel('year', fontsize=20)
ax1.tick_params(axis='x', labelsize=14)
ax1.tick_params(axis='y', labelsize=14)
fig = plt.figure(figsize=(10,6))
ax1 = fig.subplots()

# estimator의 default는 mean
sns.barplot(x='year',y='loan_amnt', data=df,  ax = ax1)
ax1.set_title('Average Amount of Loan by Year', fontsize=20)
plt.ylabel('($)', fontsize=20)
plt.xlabel('year', fontsize=20)
ax1.tick_params(axis='x', labelsize=14)
ax1.tick_params(axis='y', labelsize=14)
fig = plt.figure(figsize=(10,6))
ax1 = fig.subplots()

# lambda로 estimator 정의 가능
# len()으로 건수로 확인할 수 있음
# 연도벌 대출 건수를 시각화해서 확인
sns.barplot(x='year',y='loan_amnt', data=df,  ax = ax1, estimator=lambda x : len(x))
ax1.set_title('Average Amount of Loan by Year', fontsize=20)
plt.ylabel('count', fontsize=20)
plt.xlabel('year', fontsize=20)
ax1.tick_params(axis='x', labelsize=14)
ax1.tick_params(axis='y', labelsize=14)
지역 단위 구분
df['addr_state'].unique()

# Make a list with each of the regions by state.

west = ['CA', 'OR', 'UT','WA', 'CO', 'NV', 'AK', 'MT', 'HI', 'WY', 'ID']
south_west = ['AZ', 'TX', 'NM', 'OK']
south_east = ['GA', 'NC', 'VA', 'FL', 'KY', 'SC', 'LA', 'AL', 'WV', 'DC', 'AR', 'DE', 'MS', 'TN' ]
mid_west = ['IL', 'MO', 'MN', 'OH', 'WI', 'KS', 'MI', 'SD', 'IA', 'NE', 'IN', 'ND']
north_east = ['CT', 'NY', 'PA', 'NJ', 'RI','MA', 'MD', 'VT', 'NH', 'ME']


df['region'] = np.nan

def finding_regions(state):
    if state in west:
        return 'West'
    elif state in south_west:
        return 'SouthWest'
    elif state in south_east:
        return 'SouthEast'
    elif state in mid_west:
        return 'MidWest'
    elif state in north_east:
        return 'NorthEast'


df['region'] = df['addr_state'].apply(finding_regions)
f, ax = plt.subplots()
cmap = plt.cm.inferno
by_interest_rate = df.groupby(['year', 'region']).annual_inc.mean()
by_interest_rate.unstack().plot(kind='bar', colormap=cmap, grid=False,
legend=False, ax=ax, figsize=(10,6))
ax1.set_title('Average Interest Rate by Region', fontsize=14)Text(0.5, 1, 'Average Interest Rate by Region')
신용 등급
# Let's visualize how many loans were issued by creditscore
f, ((ax1, ax2)) = plt.subplots(1, 2)
cmap = plt.cm.coolwarm

by_credit_score = df.groupby(['year', 'grade']).loan_amnt.mean()
by_credit_score.unstack().plot(legend=False, ax=ax1, figsize=(14, 4), colormap=cmap)
ax1.set_title('Loans issued by Credit Score', fontsize=14)


by_inc = df.groupby(['year', 'grade']).int_rate.mean()
by_inc.unstack().plot(ax=ax2, figsize=(14, 4), colormap=cmap)
ax2.set_title('Interest Rates by Credit Score', fontsize=14)

ax2.legend(bbox_to_anchor=(-1.0, -0.3, 1.7, 0.1), loc=5, prop={'size':12},
           ncol=7, mode="expand", borderaxespad=0.)
<matplotlib.legend.Legend at 0x7faa9b337ac8>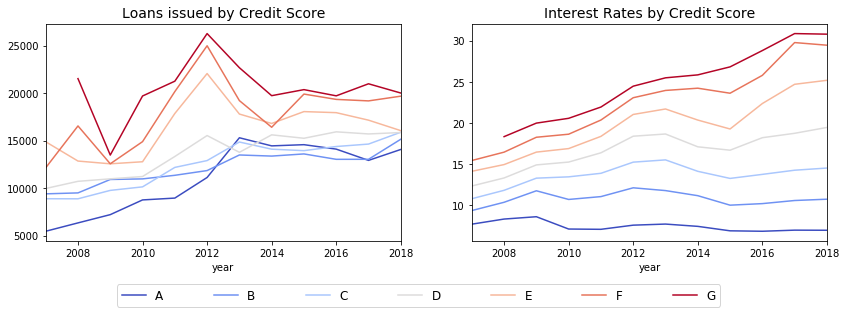
# 세부 신용 등급에 따른 대출 상태 비교
test = df.groupby(['sub_grade','loan_condition']).loan_amnt.size()
test.unstack().plot(colormap=cmap, kind='bar')
<matplotlib.axes._subplots.AxesSubplot at 0x7faa9b2fb668>
# 세부 신용 등급별 대출 상태의 비율

## 신용 등급 총합과 비율 데이터 프레임 생성
test2 = test.unstack()
test2.loc['Total',:] = test2.sum(axis=0)
test2['Total'] = test2.sum(axis=1)
test2['Good Ratio'] = test2['Good'] * 100 / test2['Total']
test2['Bad Ratio'] = test2['Bad'] * 100 / test2['Total']

## plot
test2.ix[:-1,['Good Ratio','Bad Ratio']].plot(kind='bar', colormap=cmap, figsize=(15,6))
plt.xlabel('Grade', fontsize=15)
plt.ylabel('(%)', fontsize=15)
plt.title('Loan Condition by Credit Score', fontsize=20)
plt.xticks(rotation=0)
plt.show()
test2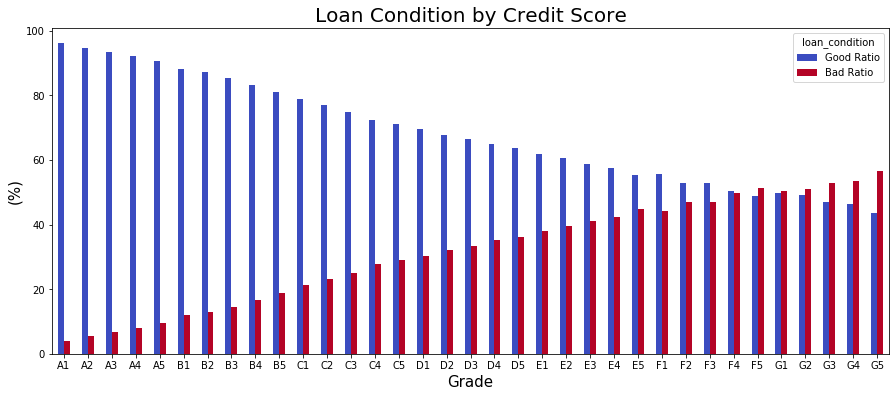
| loan_condition | Bad | Good | Total | Good Ratio | Bad Ratio |
|---|---|---|---|---|---|
| sub_grade | |||||
| --- | --- | --- | --- | --- | --- |
| A1 | 1608.0 | 39898.0 | 41506.0 | 96.125861 | 3.874139 |
| A2 | 1986.0 | 34121.0 | 36107.0 | 94.499682 | 5.500318 |
| A3 | 2443.0 | 34574.0 | 37017.0 | 93.400330 | 6.599670 |
| A4 | 4043.0 | 47043.0 | 51086.0 | 92.085894 | 7.914106 |
| A5 | 5937.0 | 56841.0 | 62778.0 | 90.542865 | 9.457135 |
| B1 | 8373.0 | 61658.0 | 70031.0 | 88.043866 | 11.956134 |
| B2 | 9389.0 | 63533.0 | 72922.0 | 87.124599 | 12.875401 |
| B3 | 11717.0 | 69071.0 | 80788.0 | 85.496608 | 14.503392 |
| B4 | 13729.0 | 68606.0 | 82335.0 | 83.325439 | 16.674561 |
| B5 | 15465.0 | 66207.0 | 81672.0 | 81.064502 | 18.935498 |
| C1 | 18015.0 | 67050.0 | 85065.0 | 78.822077 | 21.177923 |
| C2 | 18215.0 | 60870.0 | 79085.0 | 76.967819 | 23.032181 |
| C3 | 18796.0 | 56283.0 | 75079.0 | 74.965037 | 25.034963 |
| C4 | 20701.0 | 54100.0 | 74801.0 | 72.325236 | 27.674764 |
| C5 | 19705.0 | 48363.0 | 68068.0 | 71.051008 | 28.948992 |
| D1 | 15682.0 | 35999.0 | 51681.0 | 69.656160 | 30.343840 |
| D2 | 14575.0 | 30585.0 | 45160.0 | 67.725864 | 32.274136 |
| D3 | 13292.0 | 26517.0 | 39809.0 | 66.610565 | 33.389435 |
| D4 | 12625.0 | 23339.0 | 35964.0 | 64.895451 | 35.104549 |
| D5 | 11054.0 | 19399.0 | 30453.0 | 63.701442 | 36.298558 |
| E1 | 9107.0 | 14802.0 | 23909.0 | 61.909741 | 38.090259 |
| E2 | 8539.0 | 13059.0 | 21598.0 | 60.463932 | 39.536068 |
| E3 | 7682.0 | 10972.0 | 18654.0 | 58.818484 | 41.181516 |
| E4 | 6759.0 | 9189.0 | 15948.0 | 57.618510 | 42.381490 |
| E5 | 6636.0 | 8184.0 | 14820.0 | 55.222672 | 44.777328 |
| F1 | 4469.0 | 5633.0 | 10102.0 | 55.761235 | 44.238765 |
| F2 | 3426.0 | 3851.0 | 7277.0 | 52.920159 | 47.079841 |
| F3 | 2916.0 | 3284.0 | 6200.0 | 52.967742 | 47.032258 |
| F4 | 2453.0 | 2489.0 | 4942.0 | 50.364225 | 49.635775 |
| F5 | 2063.0 | 1963.0 | 4026.0 | 48.758073 | 51.241927 |
| G1 | 1536.0 | 1514.0 | 3050.0 | 49.639344 | 50.360656 |
| G2 | 1106.0 | 1067.0 | 2173.0 | 49.102623 | 50.897377 |
| G3 | 871.0 | 773.0 | 1644.0 | 47.019465 | 52.980535 |
| G4 | 707.0 | 613.0 | 1320.0 | 46.439394 | 53.560606 |
| G5 | 652.0 | 502.0 | 1154.0 | 43.500867 | 56.499133 |
| Total | 296272.0 | 1041952.0 | 1338224.0 | 77.860807 | 22.139193 |
fig = plt.figure(figsize=(16,12))

ax1 = fig.add_subplot(221)
ax2 = fig.add_subplot(222)
ax3 = fig.add_subplot(212)

cmap = plt.cm.coolwarm_r

# 등급별 대출양
loans_by_region = df.groupby(['grade', 'loan_condition']).size()
loans_by_region.unstack().plot(kind='bar', stacked=True, colormap=cmap, ax=ax1, grid=False)
ax1.set_title('Type of Loans by Grade', fontsize=14)

# 세부 등급별
loans_by_grade = df.groupby(['sub_grade', 'loan_condition']).size()
loans_by_grade.unstack().plot(kind='bar', stacked=True, colormap=cmap, ax=ax2, grid=False)
ax2.set_title('Type of Loans by Sub-Grade', fontsize=14)

# 연도별 평균 이자율
by_interest = df.groupby(['year', 'loan_condition']).int_rate.mean()
by_interest.unstack().plot(ax=ax3, colormap=cmap)
ax3.set_title('Average Interest rate by Loan Condition', fontsize=14)
ax3.set_ylabel('Interest Rate (%)', fontsize=12)
plt.show()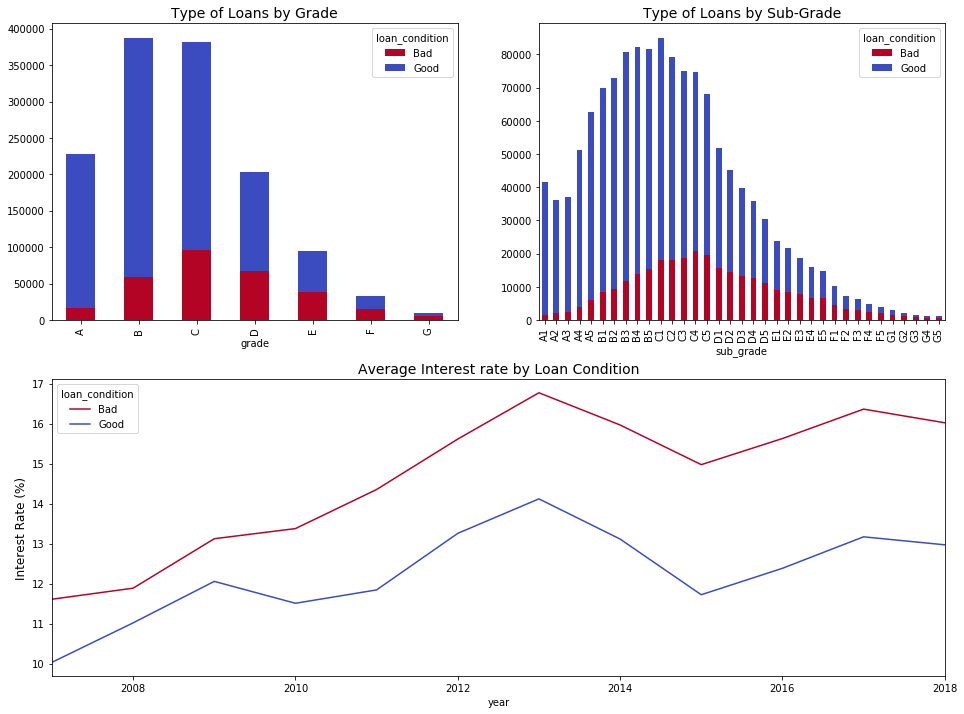
마무리
EDA 진행 과정에서 발생된 기본적인 데이터 시각화에 관련해서 소스코드를 모아서 작성하였습니다.
다음 글에서는 데이터 전처리를 진행하고 전처리에 해당되는 소스코드를 첨부하겠습니다.
이전글 / 참고자료 / 소스코드첨부
- [파이썬/데이터사이언스] - [파이썬 데이터분석] LendingClub 원금 상환 여부 예측하기(1) : EDA와 데이터 시각화
- Kaggle Janio Martinez의 Notebook
- 소스코드 첨부
[파이썬 데이터분석] LendingClub 원금 상환 여부 예측하기(1) : EDA와 데이터 시각화
이번 포스팅을 시작으로 Lending Club의 데이터를 활용해 파이썬 데이터 분석을 진행해볼 예정입니다. 파이썬이 데이터 분석하기에 좋고 강력한 library들도 많이 있습니다. 현재 4차 산업 양성과정의 빅데이터 AI..
chancoding.tistory.com
Lending Club || Risk Analysis and Metrics
Explore and run machine learning code with Kaggle Notebooks | Using data from Lending Club Loan Data
www.kaggle.com
'파이썬 > 머신러닝' 카테고리의 다른 글
| [파이썬] 교차검증 Cross Validation 검증 (0) | 2020.03.26 |
|---|---|
| [DACON] AI프렌즈 시즌1 온도 추정 경진대회 - 01 : 대회 소개 및 참여 (0) | 2020.03.24 |
| [파이썬] 실습 데이터를 사용한 SVM 모델 생성 및 예측, C와 감마(Gamma) (3) | 2020.03.18 |
| [파이썬 머신러닝] Kaggle 타이타닉 데이터 생존자 예측모델 RandomForest와 DecisionTree (1) | 2020.03.16 |
| [파이썬/데이터분석] LendingClub 원금 상환 여부 예측하기(1) : EDA와 데이터 시각화 (0) | 2020.03.12 |
| [머신러닝] PCA 실습 (2) : 주성분분석이 성능을 높여주는가? (2) | 2020.03.04 |
| [머신러닝] 실습으로 보는 PCA(주성분 분석)가 필요한 이유 (3) | 2020.03.02 |
| [머신러닝] PCA(principal component analysis) 차원 축소에 대해 (1) | 2020.03.02 |


