차밍이
[파이썬] 실습 데이터를 사용한 SVM 모델 생성 및 예측, C와 감마(Gamma) 본문
Intro
SVM 모델을 사용해서 핸드폰 가격 예측 모델을 만들어볼 예정입니다. 진행 과정에서 SVM 모델에서 C와 감마에 대해서 가볍게 알아볼 예정입니다.
Library
기본적인 라이브러리와 데이터를 가져오도록 합니다. 이후, 데이터의 기본적인 구조와 상태를 확인합니다.
import numpy as np
import pandas as pd
import seaborn as sns
import matplotlib.pyplot as plt
from matplotlib.colors import ListedColormap
df=pd.read_csv(r"C:\Users\chan\Desktop\딥러닝 수업\mobile-price-classification\train.csv")
test=pd.read_csv(r"C:\Users\chan\Desktop\딥러닝 수업\mobile-price-classification\test.csv")
df.head()데이터 프래임 확인
| battery_power | blue | clock_speed | dual_sim | fc | four_g | int_memory | m_dep | mobile_wt | n_cores | ... | px_height | px_width | ram | sc_h | sc_w | talk_time | three_g | touch_screen | wifi | price_range | |
|---|---|---|---|---|---|---|---|---|---|---|---|---|---|---|---|---|---|---|---|---|---|
| 0 | 842 | 0 | 2.2 | 0 | 1 | 0 | 7 | 0.6 | 188 | 2 | ... | 20 | 756 | 2549 | 9 | 7 | 19 | 0 | 0 | 1 | 1 |
| 1 | 1021 | 1 | 0.5 | 1 | 0 | 1 | 53 | 0.7 | 136 | 3 | ... | 905 | 1988 | 2631 | 17 | 3 | 7 | 1 | 1 | 0 | 2 |
| 2 | 563 | 1 | 0.5 | 1 | 2 | 1 | 41 | 0.9 | 145 | 5 | ... | 1263 | 1716 | 2603 | 11 | 2 | 9 | 1 | 1 | 0 | 2 |
| 3 | 615 | 1 | 2.5 | 0 | 0 | 0 | 10 | 0.8 | 131 | 6 | ... | 1216 | 1786 | 2769 | 16 | 8 | 11 | 1 | 0 | 0 | 2 |
| 4 | 1821 | 1 | 1.2 | 0 | 13 | 1 | 44 | 0.6 | 141 | 2 | ... | 1208 | 1212 | 1411 | 8 | 2 | 15 | 1 | 1 | 0 | 1 |
5 rows × 21 columns
결측치 확인
df.isnull().sum()battery_power 0
blue 0
clock_speed 0
dual_sim 0
fc 0
four_g 0
int_memory 0
m_dep 0
mobile_wt 0
n_cores 0
pc 0
px_height 0
px_width 0
ram 0
sc_h 0
sc_w 0
talk_time 0
three_g 0
touch_screen 0
wifi 0
price_range 0
dtype: int64feature의 종류 확인
df.columnsIndex(['battery_power', 'blue', 'clock_speed', 'dual_sim', 'fc', 'four_g',
'int_memory', 'm_dep', 'mobile_wt', 'n_cores', 'pc', 'px_height',
'px_width', 'ram', 'sc_h', 'sc_w', 'talk_time', 'three_g',
'touch_screen', 'wifi', 'price_range'],
dtype='object')Target Value 확인
df['price_range'].describe()count 2000.000000
mean 1.500000
std 1.118314
min 0.000000
25% 0.750000
50% 1.500000
75% 2.250000
max 3.000000
Name: price_range, dtype: float64데이터프래임의 기본 상태 확인
df.info()<class 'pandas.core.frame.DataFrame'>
RangeIndex: 2000 entries, 0 to 1999
Data columns (total 21 columns):
battery_power 2000 non-null int64
blue 2000 non-null int64
clock_speed 2000 non-null float64
dual_sim 2000 non-null int64
fc 2000 non-null int64
four_g 2000 non-null int64
int_memory 2000 non-null int64
m_dep 2000 non-null float64
mobile_wt 2000 non-null int64
n_cores 2000 non-null int64
pc 2000 non-null int64
px_height 2000 non-null int64
px_width 2000 non-null int64
ram 2000 non-null int64
sc_h 2000 non-null int64
sc_w 2000 non-null int64
talk_time 2000 non-null int64
three_g 2000 non-null int64
touch_screen 2000 non-null int64
wifi 2000 non-null int64
price_range 2000 non-null int64
dtypes: float64(2), int64(19)
memory usage: 328.2 KBTarget value의 종류 확인
# 가격대를 나타내는 target value 확인
df['price_range'].unique()
array([1, 2, 3, 0], dtype=int64)Target value인 가격 범위는 0, 1 ,2 ,3으로 구성된 카테고리형 데이터인 것을 확인할 수 있습니다. 카테고리형 데이터이므로 분류 문제로 접근하면 되겠습니다.
SVM 모델은 회귀모델인지 분류모델인지에 따라서 달라집니다. 아래에서 svm을 사용하는 곳에서 확인해보겠습니다.
상관관계 분석
corrmat=df.corr()
plt.subplots(figsize=(12,10))
sns.heatmap(corrmat,vmax=0.8, square=True, annot=True, annot_kws={'size':8}
<matplotlib.axes._subplots.AxesSubplot at 0x1ccf81b2588>

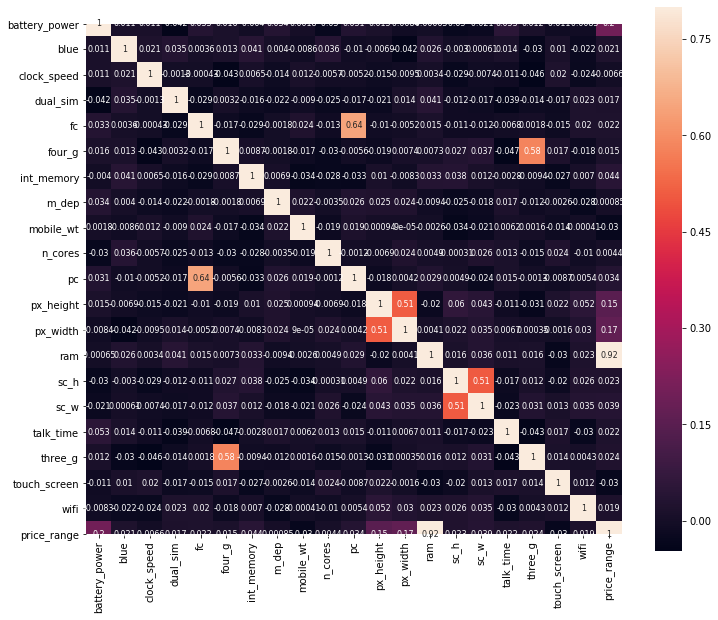
전반적으로 상관관계가 없는 것을 알 수 있으며 일부 feature들 사이의 상관관계가 발생되는 것을 확인할 수 있습니다. 특히나 RAM은 target value와 매우 밀접한 관련이 있는 것을 확인할 수 있습니다.
그래프를 통한 관계 확인
plt.subplots(figsize=(10,4))
plt.scatter(y=df['price_range'], x=df['battery_power'], color='red')
plt.scatter(y=df['price_range'], x=df['ram'], color='green')
plt.scatter(y=df['price_range'], x=df['n_cores'], color='blue')
plt.scatter(y=df['price_range'], x=df['mobile_wt'], color='orange')
<matplotlib.collections.PathCollection at 0x1cc933d8fc8>
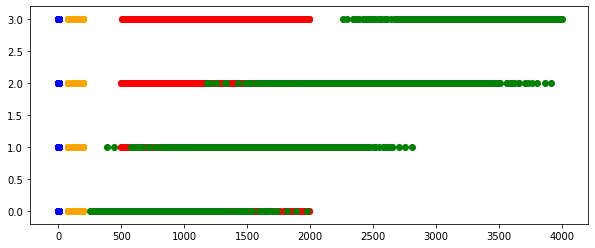
전반적으로 다른 값들의 상관성이 높은 것은 찾아보기 어렵습니다. 반면 초록색(RAM)의 경우는 전체적으로 우상향하는 것을 볼 수 있습니다. 이러한 부분에서 상관성이 왜 높은 값이 나왔는지 알 수 있습니다.
SVM 모델 생성
SVC 는 분류형 모델, SVR은 회귀형(예측) 모델입니다. Target 변수가 카테고리형 이므로 분류 모델인 SVC를 사용해야 합니다.
from sklearn.svm import SVC
from sklearn.model_selection import train_test_split
from sklearn.preprocessing import MinMaxScaler
# feature와 target 분리
yt=np.array(df['price_range'])
xt=df.drop(['price_range'], axis=1)
xt=np.array(xt)scaler=MinMaxScaler()
xt=scaler.fit_transform(xt)# train test 데이터 split
xtrain,xtest,ytrain,ytest=train_test_split(xt, yt, test_size=0.2, random_state=42)Linear SVM 모델에서 C 값에 따라서 정확도가 바뀝니다. 여기서 C는 slack variable weight 슬랙 변수의 가중치를 의미합니다. 이 값이 분류를 하는데 오차 허용하는 범위인 마진 값을 조정합니다. C 값이 커지면 허용 오차의 개수가 작아지므로 가중치 값에 집중하는 경항이 발생합니다. 이에 따라 margin이 좁아집니다.
C 값이 작아지면 margin은 커지게 됩니다. C 값을 통해서 margin 폭을 유연하게 조절할 수 있습니다. C 값에 따라서 어떻게 변하는지 확인해 보겠습니다.
#Linear SVM을 위한 적절한 C값  검색
#분류:SVC, 회귀(예측):SVR

scores = []
for thisC in [*range(1,100)]:
    svc=SVC(kernel='linear',C=thisC)
    model=svc.fit(xtrain,ytrain)
    scoreTrain=model.score(xtrain,ytrain)
    scoreTest=model.score(xtest,ytest)
    print("선형 SVM : C:{}, training score:{:2f}, test score:{:2f}".format
          (thisC,scoreTrain, scoreTest))
    scores.append([scoreTrain, scoreTest])
선형 SVM : C:1, training score:0.953750, test score:0.960000
선형 SVM : C:2, training score:0.959375, test score:0.975000
선형 SVM : C:3, training score:0.961875, test score:0.977500
선형 SVM : C:4, training score:0.968125, test score:0.972500
선형 SVM : C:5, training score:0.968125, test score:0.975000
선형 SVM : C:6, training score:0.969375, test score:0.980000
선형 SVM : C:7, training score:0.970625, test score:0.967500
선형 SVM : C:8, training score:0.975000, test score:0.967500
선형 SVM : C:9, training score:0.975000, test score:0.962500
선형 SVM : C:10, training score:0.977500, test score:0.967500
선형 SVM : C:11, training score:0.975625, test score:0.967500
선형 SVM : C:12, training score:0.976250, test score:0.970000
선형 SVM : C:13, training score:0.977500, test score:0.965000
선형 SVM : C:14, training score:0.977500, test score:0.967500
선형 SVM : C:15, training score:0.978125, test score:0.967500
선형 SVM : C:16, training score:0.978750, test score:0.965000
선형 SVM : C:17, training score:0.979375, test score:0.960000
선형 SVM : C:18, training score:0.979375, test score:0.957500
선형 SVM : C:19, training score:0.980000, test score:0.965000
선형 SVM : C:20, training score:0.980000, test score:0.967500
선형 SVM : C:21, training score:0.980625, test score:0.967500
선형 SVM : C:22, training score:0.980000, test score:0.965000
선형 SVM : C:23, training score:0.980625, test score:0.962500
선형 SVM : C:24, training score:0.979375, test score:0.962500
선형 SVM : C:25, training score:0.981250, test score:0.962500
선형 SVM : C:26, training score:0.979375, test score:0.970000
선형 SVM : C:27, training score:0.980000, test score:0.965000
선형 SVM : C:28, training score:0.980625, test score:0.960000
선형 SVM : C:29, training score:0.981250, test score:0.960000
선형 SVM : C:30, training score:0.981250, test score:0.960000
선형 SVM : C:31, training score:0.981250, test score:0.960000
선형 SVM : C:32, training score:0.981875, test score:0.962500
선형 SVM : C:33, training score:0.981875, test score:0.962500
선형 SVM : C:34, training score:0.982500, test score:0.962500
선형 SVM : C:35, training score:0.981875, test score:0.962500
선형 SVM : C:36, training score:0.981250, test score:0.962500
선형 SVM : C:37, training score:0.981250, test score:0.962500
선형 SVM : C:38, training score:0.981250, test score:0.962500
선형 SVM : C:39, training score:0.981250, test score:0.962500
선형 SVM : C:40, training score:0.981250, test score:0.962500
선형 SVM : C:41, training score:0.981875, test score:0.962500
선형 SVM : C:42, training score:0.983125, test score:0.962500
선형 SVM : C:43, training score:0.981875, test score:0.967500
선형 SVM : C:44, training score:0.981875, test score:0.965000
선형 SVM : C:45, training score:0.981875, test score:0.967500
선형 SVM : C:46, training score:0.981875, test score:0.967500
선형 SVM : C:47, training score:0.981875, test score:0.967500
선형 SVM : C:48, training score:0.982500, test score:0.970000
선형 SVM : C:49, training score:0.982500, test score:0.967500
선형 SVM : C:50, training score:0.981875, test score:0.965000
선형 SVM : C:51, training score:0.981875, test score:0.965000
선형 SVM : C:52, training score:0.981875, test score:0.967500
선형 SVM : C:53, training score:0.980625, test score:0.967500
선형 SVM : C:54, training score:0.980625, test score:0.965000
선형 SVM : C:55, training score:0.981250, test score:0.965000
선형 SVM : C:56, training score:0.981875, test score:0.965000
선형 SVM : C:57, training score:0.981875, test score:0.965000
선형 SVM : C:58, training score:0.981875, test score:0.965000
선형 SVM : C:59, training score:0.981250, test score:0.962500
선형 SVM : C:60, training score:0.981250, test score:0.962500
선형 SVM : C:61, training score:0.981250, test score:0.962500
선형 SVM : C:62, training score:0.981250, test score:0.962500
선형 SVM : C:63, training score:0.981875, test score:0.967500
선형 SVM : C:64, training score:0.981875, test score:0.967500
선형 SVM : C:65, training score:0.981875, test score:0.967500
선형 SVM : C:66, training score:0.981250, test score:0.967500
선형 SVM : C:67, training score:0.981250, test score:0.967500
선형 SVM : C:68, training score:0.980625, test score:0.967500
선형 SVM : C:69, training score:0.981250, test score:0.967500
선형 SVM : C:70, training score:0.981250, test score:0.967500
선형 SVM : C:71, training score:0.981875, test score:0.967500
선형 SVM : C:72, training score:0.981875, test score:0.967500
선형 SVM : C:73, training score:0.981250, test score:0.970000
선형 SVM : C:74, training score:0.981250, test score:0.970000
선형 SVM : C:75, training score:0.981250, test score:0.970000
선형 SVM : C:76, training score:0.981250, test score:0.970000
선형 SVM : C:77, training score:0.981250, test score:0.970000
선형 SVM : C:78, training score:0.981250, test score:0.970000
선형 SVM : C:79, training score:0.981875, test score:0.970000
선형 SVM : C:80, training score:0.981875, test score:0.970000
선형 SVM : C:81, training score:0.981875, test score:0.970000
선형 SVM : C:82, training score:0.981875, test score:0.972500
선형 SVM : C:83, training score:0.981875, test score:0.972500
선형 SVM : C:84, training score:0.980625, test score:0.972500
선형 SVM : C:85, training score:0.980625, test score:0.970000
선형 SVM : C:86, training score:0.980625, test score:0.970000
선형 SVM : C:87, training score:0.980625, test score:0.970000
선형 SVM : C:88, training score:0.980625, test score:0.970000
선형 SVM : C:89, training score:0.980000, test score:0.970000
선형 SVM : C:90, training score:0.980000, test score:0.970000
선형 SVM : C:91, training score:0.980000, test score:0.970000
선형 SVM : C:92, training score:0.980000, test score:0.970000
선형 SVM : C:93, training score:0.980000, test score:0.970000
선형 SVM : C:94, training score:0.980625, test score:0.970000
선형 SVM : C:95, training score:0.980625, test score:0.970000
선형 SVM : C:96, training score:0.980625, test score:0.970000
선형 SVM : C:97, training score:0.980625, test score:0.970000
선형 SVM : C:98, training score:0.980625, test score:0.967500
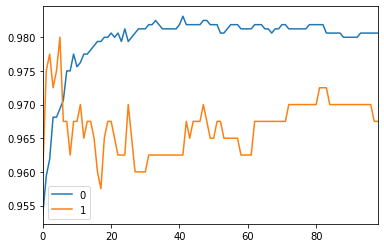
선형 SVM : C:99, training score:0.980625, test score:0.967500쭉 결과를 살펴보면 어느 정도를 지나면 더 이상 값이 변하지 않고 반복되는 것을 확인할 수 있습니다. 즉 더 이상은 의미가 없는 경우라고 생각할 수 있습니다. 그래도 C 값을 조정하면서 조금씩 결과가 달라지는 것을 볼 수 있습니다. 아래의 그래프를 통해 살펴보겠습니다.
# C값에 따른 train test 정확도 비교
pd.DataFrame(scores).plot()
<matplotlib.axes._subplots.AxesSubplot at 0x1cc9339dac8>
Cross Validation
Cross Validation score 적용하여 결과를 확인할 수 있습니다. CV를 통해서 과적합되는 것을 줄이고 전체적인 데이터를 고르게 사용할 수 있는 장점이 있습니다. 또한 StratifiedKFold를 사용해서 cv를 적용하는 방법도 있습니다.
from sklearn.model_selection import cross_val_score, StratifiedKFold

model=SVC(kernel='linear', C=20).fit(xtrain,ytrain)
scores=cross_val_score(model, xtrain, ytrain, cv=5)
print("CV 점수 : " +str(scores))
st_scores=cross_val_score(model, xtrain, ytrain,cv=StratifiedKFold(5, random_state=10, shuffle=True))
print("StratifiedKFold CV 점수 : " +str(st_scores))
print()
print("CV 평균점수 : " +str(scores.mean()))
print("StratifiedKFold CV 평균점수 : " +str(st_scores.mean()))
CV 점수 : [0.95 0.9625 0.95 0.925 0.971875]
StratifiedKFold CV 점수 : [0.95625 0.95 0.94375 0.971875 0.94375 ]
CV 평균점수 : 0.9518749999999999
StratifiedKFold CV 평균점수 : 0.953125LinearSVC
LinearSVC를 사용해서 같은 모델을 만들 수 있습니다. LinearSVC는 일반 SVC 보다 훨씬 빠른 결과를 도출합니다. 반면 전체적인 성능이 떨어지게 됩니다. 따라서 데이터가 매우 커진다면 간단하게 LinearSVC로 적합한 C와 감마 값을 찾은 후 SVC를 돌리는 등으로 응용할 수도 있을 것 같습니다.
from sklearn.svm import LinearSVC

for thisC in [1,3,5,10,40,60,80,100]:
    model2=LinearSVC(C=thisC).fit(xtrain,ytrain)
    scoretrain=model2.score(xtrain,ytrain)
    scoretest=model2.score(xtest,ytest)
    print("선형 SVM : C:{}, training score:{:2f}, test score:{:2f} \n".format(thisC,scoretrain, scoretest))

#LinearSVC(속도 빠름), SVC(느림, 커널 트릭 지원)
#실제 작업시 비교하여 사용할 것
선형 SVM : C:1, training score:0.846250, test score:0.840000
선형 SVM : C:3, training score:0.864375, test score:0.855000
선형 SVM : C:5, training score:0.867500, test score:0.872500
선형 SVM : C:10, training score:0.874375, test score:0.875000
선형 SVM : C:40, training score:0.826875, test score:0.827500
선형 SVM : C:60, training score:0.844375, test score:0.837500
선형 SVM : C:80, training score:0.807500, test score:0.810000
선형 SVM : C:100, training score:0.814375, test score:0.807500 Gamma
Gamma 값을 사용해서도 SVM의 성능이 달라지는 것을 확인할 수 있습니다. Gamma에 대한 설명은 다른 분의 블로그에 잘 설명되어있어 링크를 첨부합니다. https://bskyvision.com/163
C와 Gamma를 아래와 같이 하나씩 찾아간다면 매우 불편할 것입니다.
#RBF 커널 SVM, C와 gamma 퍼러미터 사용
for thisGamma in [.1, .25, .5, 1]:
    for thisC in [1,5,10,20,40,100]:
        model3=SVC(kernel="rbf", C=thisC,
                   gamma=thisGamma).fit(xtrain, ytrain)
        m3train=model3.score(xtrain,ytrain)
        m3test=model3.score(xtest,ytest)
        print("RBF SVM : C:{}, gamma:{},training score:{:2f},test score:{:2f} \n".format(thisC, thisGamma, m3train, m3test))
RBF SVM : C:1, gamma:0.1,training score:0.928750,test score:0.902500
RBF SVM : C:5, gamma:0.1,training score:0.965000,test score:0.907500
RBF SVM : C:10, gamma:0.1,training score:0.979375,test score:0.907500
RBF SVM : C:20, gamma:0.1,training score:0.990000,test score:0.912500
RBF SVM : C:40, gamma:0.1,training score:0.995000,test score:0.902500
RBF SVM : C:100, gamma:0.1,training score:1.000000,test score:0.907500
RBF SVM : C:1, gamma:0.25,training score:0.959375,test score:0.887500
RBF SVM : C:5, gamma:0.25,training score:0.990000,test score:0.872500
RBF SVM : C:10, gamma:0.25,training score:0.998125,test score:0.895000
RBF SVM : C:20, gamma:0.25,training score:1.000000,test score:0.902500
RBF SVM : C:40, gamma:0.25,training score:1.000000,test score:0.897500
RBF SVM : C:100, gamma:0.25,training score:1.000000,test score:0.897500
RBF SVM : C:1, gamma:0.5,training score:0.980625,test score:0.835000
RBF SVM : C:5, gamma:0.5,training score:1.000000,test score:0.850000
RBF SVM : C:10, gamma:0.5,training score:1.000000,test score:0.847500
RBF SVM : C:20, gamma:0.5,training score:1.000000,test score:0.847500
RBF SVM : C:40, gamma:0.5,training score:1.000000,test score:0.847500
RBF SVM : C:100, gamma:0.5,training score:1.000000,test score:0.847500
RBF SVM : C:1, gamma:1,training score:0.993125,test score:0.712500
RBF SVM : C:5, gamma:1,training score:1.000000,test score:0.742500
RBF SVM : C:10, gamma:1,training score:1.000000,test score:0.742500
RBF SVM : C:20, gamma:1,training score:1.000000,test score:0.742500
RBF SVM : C:40, gamma:1,training score:1.000000,test score:0.742500
RBF SVM : C:100, gamma:1,training score:1.000000,test score:0.742500 GridSearchCV
GridSearchCV를 사용하면 최적의 parameter와 그때의 score값을 한 번에 찾을 수 있습니다.
from sklearn.model_selection import GridSearchCV
param={'C':[1,5,10,20,40,100],
      'gamma':[.1, .25, .5, 1]}
GS=GridSearchCV(SVC(kernel='rbf'),param, cv=5)
GS.fit(xtrain, ytrain)
print(GS.best_params_)
print(GS.best_score_)
{'C': 10, 'gamma': 0.1}
0.903125Prediction
test데이터에 적용한 후 최종 예측값을 얻어냅니다.
test=test.drop(['id'],axis=1)
test.head()
testmat=np.array(test)
test=scaler.fit_transform(test)
#test(DF -> array)
model=SVC(kernel='rbf', C=5, gamma=.1).fit(xtrain, ytrain)
prediction=model.predict(test)
pred=pd.DataFrame(prediction)
pred| 0 | |
|---|---|
| 0 | 3 |
| 1 | 3 |
| 2 | 2 |
| 3 | 3 |
| 4 | 1 |
| ... | ... |
| 995 | 2 |
| 996 | 1 |
| 997 | 1 |
| 998 | 2 |
| 999 | 2 |
1000 rows × 1 columns
마무리
지금까지 파이썬에서 SVC를 사용하는 방법을 실습 데이터를 바탕으로 간단하게 알아보았습니다. SVM은 딥러닝의 혁명이 일어나기 전까지 아주 강력하고 성능이 좋은 알고리즘으로 많이 사용되었습니다. 반면 단점으로는 매우 느리다는 것입니다. 자신의 데이터와 원하는 방식에 맞게 잘 사용하면 좋을 것 같습니다.
'파이썬 > 머신러닝' 카테고리의 다른 글
| [DACON] AI프렌즈 시즌1 온도 추정 경진대회 - 02 : 대회 종료 및 소감 (0) | 2020.04.14 |
|---|---|
| [파이썬] 교차검증 Cross Validation 검증 (0) | 2020.03.26 |
| [DACON] AI프렌즈 시즌1 온도 추정 경진대회 - 01 : 대회 소개 및 참여 (0) | 2020.03.24 |
| [파이썬 머신러닝] Kaggle 타이타닉 데이터 생존자 예측모델 RandomForest와 DecisionTree (1) | 2020.03.16 |
| [파이썬/데이터분석] LendingClub 원금 상환 여부 예측하기(2) 시각화 소스코드 (0) | 2020.03.12 |
| [파이썬/데이터분석] LendingClub 원금 상환 여부 예측하기(1) : EDA와 데이터 시각화 (0) | 2020.03.12 |
| [머신러닝] PCA 실습 (2) : 주성분분석이 성능을 높여주는가? (2) | 2020.03.04 |
| [머신러닝] 실습으로 보는 PCA(주성분 분석)가 필요한 이유 (3) | 2020.03.02 |


