차밍이
[Python] Plotly : subplot 만들기의 모든것 - subtitle, type 설정 포함 본문
목차
Subplot 기본 구조 그리기
make_subplots 함수를 사용해서 서브플롯 생성
rows와 cols 값을 통해서 몇 행, 몇 열로 그래프를 그릴지 설정하면 됨
import plotly.graph_objects as go
from plotly.subplots import make_subplots

fig = make_subplots(rows=2, cols=2) # make_subplots를 사용해서 서브플롯 구조를 그림
Subplot에 Subtitle 설정하기
start_cell subplot 번호 시작 위치를 바꿀 수 있음.
설정을 바꾸지 않으면 왼쪽 위부터 시작함
subplot_titles 각 Subplot 마다 부제목을 달아줄 수 있음
fig객체에 add_trace를 통해서 그래프를 추가해주면 됨
import plotly.graph_objects as go
from plotly.subplots import make_subplots

fig = make_subplots(
    rows=2, cols=2,
    start_cell="bottom-left",  # 시작 위치를 바꿀 수 있음
    subplot_titles=("Plot 1", "Plot 2", "Plot 3", "Plot 4") # 각 Subplot 별 subtitle 넣기
)


fig.add_trace(go.Scatter(x=[1, 2, 3], y=[4, 5, 6], name="1번 Plot"), # name 주면 Legend 이름 설정
              row=1, col=1)
fig.add_trace(go.Scatter(x=[20, 30, 40], y=[50, 60, 70]),
              row=1, col=2)
fig.add_trace(go.Scatter(x=[300, 400, 500], y=[600, 700, 800]),
              row=2, col=1)
fig.add_trace(go.Scatter(x=[4000, 5000, 6000], y=[7000, 8000, 9000]),
              row=2, col=2)

fig.show()
legend 넣는 방법은 아래글을 참고
[Python] Plotly legend(범례) 의 모든 것 - 순서, 위치, 폰트 등
Subplot 축 공유, 그래프 간격 설정, 그래프 비율 설정
shared_yaxes y축에 대해서 축을 공유하도록 그래프를 그릴 수 있음
horizontal_spacing 가로축 방향으로 서브플롯 간의 간격을 설정할 수 있음
수직 방향으로 위아래 그래프 간격은 vertical_spacing으로 설정하면 됨
column_widths 전체 그래프 그림에서 그래프의 너비 비중을 조절할 수 있음
아래 Case에 대해서 첫 번째 Subplot을 더 넓게 그리고 싶다면 column_widths=[0.7, 0.3]으로 설정한다.
그러면 첫 번째 서브플롯의 비율이 70%를 차지해 더 넓게 그려진다.
fig = make_subplots(
    rows=1, cols=2,
    shared_yaxes=True, # 특정 축을 공유하게 그래프를 그릴 수 있음
    horizontal_spacing=0.05, # 너비 간격을 설정할 수 있음
    column_widths=[0.7, 0.3] # Subplot 높이와 너비를 조절할 수 있음
)
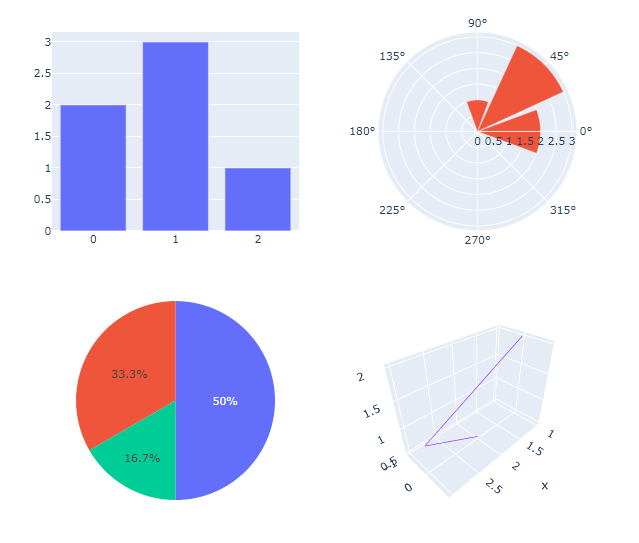
Subplots 별 타입 설정
각 Subplot 들이 가지는 type을 설정해 주어야함.
보통 일반 xy 축 그래프를 그리므로 기본 값으로 되어있어 설정하지 않음
pie 그래프 또는 다른 domain을 가지는 그래프를 그릴 때에는 설정해주어야함
설정할 수 있는 축 type 옵션들은 다음과 같다. (plotly doc 출처)
"xy": 2D Cartesian subplot type for scatter, bar, etc. This is the default if notypeis specified."scene": 3D Cartesian subplot for scatter3d, cone, etc."polar": Polar subplot for scatterpolar, barpolar, etc."ternary": Ternary subplot for scatterternary."mapbox": Mapbox subplot for scattermapbox."domain": Subplot type for traces that are individually positioned. pie, parcoords, parcats, etc.
from plotly.subplots import make_subplots
import plotly.graph_objects as go

fig = make_subplots(
    rows=2, cols=2,
    specs=[[{"type": "xy"}, {"type": "polar"}],
           [{"type": "domain"}, {"type": "scene"}]],
)

fig.add_trace(go.Bar(y=[2, 3, 1]),
              row=1, col=1)

fig.add_trace(go.Barpolar(theta=[0, 45, 90], r=[2, 3, 1]),
              row=1, col=2)

fig.add_trace(go.Pie(values=[2, 3, 1]),
              row=2, col=1)

fig.add_trace(go.Scatter3d(x=[2, 3, 1], y=[0, 0, 0],
                           z=[0.5, 1, 2], mode="lines"),
              row=2, col=2)

fig.update_layout(height=700, showlegend=False)

fig.show()
type을 넣는 대신 해당 그래프 타입을 넣어도 똑같이 동작한다.
# 위와 동일한 domain 타입 설정을 그래프 타입으로 설정한 것
fig = make_subplots(
    rows=2, cols=2,
    specs=[[{"type": "bar"}, {"type": "barpolar"}],
           [{"type": "pie"}, {"type": "scatter3d"}]],
)"xy", "polar", "domain", "scene" >>>>>>> "bar", "barpolar", "pie", "scatter3d"
Subplot Graph Example
import plotly.graph_objects as go
from plotly.subplots import make_subplots

fig = make_subplots(
    rows=1, cols=2,
    shared_yaxes=True,
    subplot_titles=("<b>A Data</b>", "<b>B Data</b>")
)
fig.add_trace(
    go.Histogram(x=t[t['SUM']>0]['RANK'].values, nbinsx=30, name="A Risk"),
    row=1, col=1
)

fig.add_trace(
    go.Histogram(x=t2[t2['SUM']>0]['RANK'].values, nbinsx=30, name="B Risk"),
    row=1, col=2
)

fig.update_layout(
    title=dict(
        text = "<b>데이터 분포 확인</b><br><sup>OO 기준에 따라서 위험도 비교 분석</sup>",
        x=0.5, y=0.94,
        font=dict(
            family="Arial",
            size=30,
            color="#000000"
        )
    ),
    legend=dict(
        orientation="h",
        xanchor="left"
    )
)

fig.update_yaxes(range=[0, 25])
'파이썬 > 데이터 시각화' 카테고리의 다른 글
| [Python] Plotly 누적 그룹 막대 그래프 그리기 - Stack and Group Bar Chart (0) | 2023.01.27 |
|---|---|
| [Python] Plotly 그래프 사용법 - Bar Plot (0) | 2023.01.21 |
| [Plotly] express와 graph_objects의 차이 / px와 go 차이 (0) | 2023.01.20 |
| [Python] Plotly legend(범례) 의 모든 것 - 순서, 위치, 폰트 등 (0) | 2022.07.23 |
| [Python] Plotly 자주 사용하는 Layout 설정 - title, 축 label, font, subtitle, position 등 (4) | 2022.06.19 |
| [Python] Plotly 축 반전, x축 y축 반전 뒤집기 (2) | 2022.02.14 |
| [Python] Plotly 그래프 사용법 - Line Plot (0) | 2021.01.28 |
| [Python] Plotly 그래프 사용법 - Scatter Plot (0) | 2021.01.27 |


