차밍이
[Python] Scatter Plot Animation - 영상 그래프 제작 본문
반응형
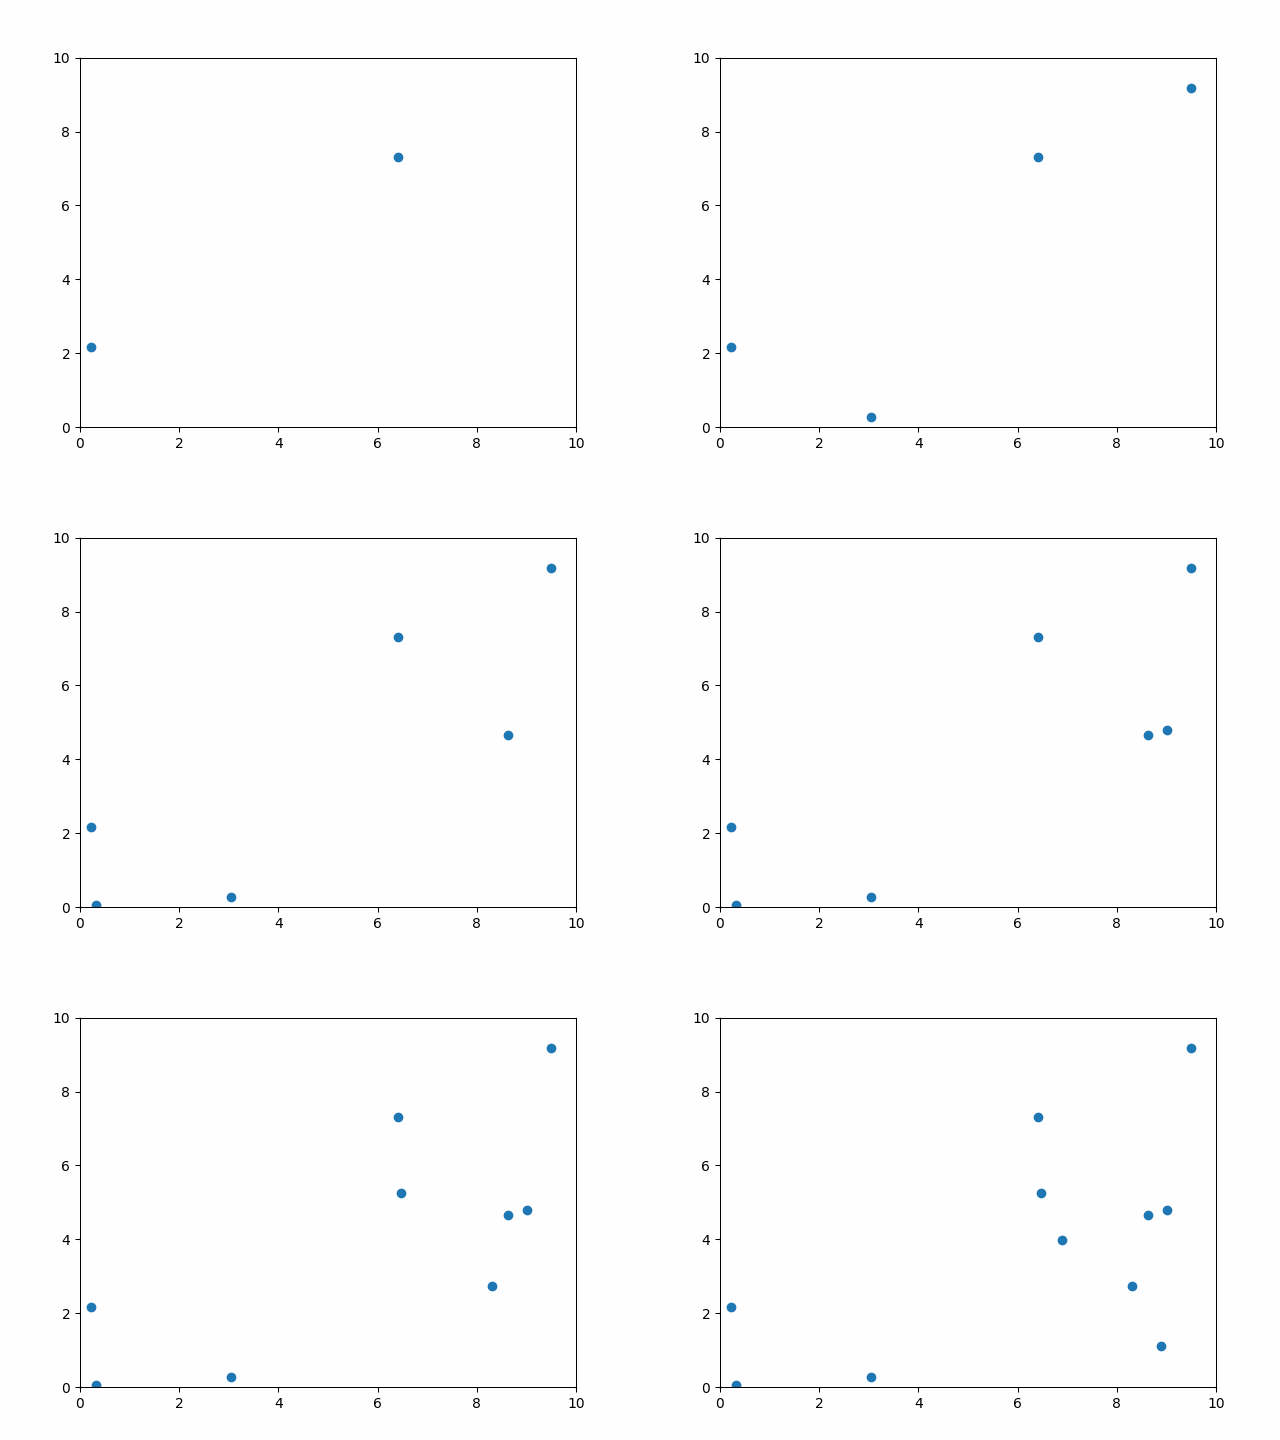
Scatter Plot Animation
matplotlib.animation.FuncAnimation
class matplotlib.animation.FuncAnimation(fig, func, frames=None, init_func=None, fargs=None, save_count=None, , *cache_frame_data=True, *kwargs*)
def func(frame, *fargs) -> iterable_of_artistsmatplotlib에서도 애니메이션 형식으로 움직이는 그래프를 그려줄 수 있다.
그림을 그려줄 fig객체와 시간에 따라 변화하는 데이터의 변화를 어떻게 정의할 것인지에 대한 함수(func)가 필요하다.
보통 matplotlib 에니메이션 관련해서 검색하면 전체 데이터를 뿌려주고 해당 점들이 움직이는 모습에 대해서만 나온다.
그래서 그래프에 scatter 점이 하나씩 늘어나는 방식의 코드가 필요해서 가져왔다.
Source Code
import matplotlib.pyplot as plt
import matplotlib.animation
import numpy as np

fig, ax = plt.subplots()
x, y = [],[]
sc = ax.scatter(x,y)
plt.xlim(0,10)
plt.ylim(0,10)

def animate(i):
    x.append(np.random.rand(1)*10)
    y.append(np.random.rand(1)*10)
    sc.set_offsets(np.c_[x,y])

ani = matplotlib.animation.FuncAnimation(fig, animate,
                frames=10, interval=100, repeat=True)

ani.save('out2.gif')
plt.show()

반응형
'파이썬 > 기본 문법 정리' 카테고리의 다른 글
| [Python] 멀티 프로세싱 사용하기 - 멀티 프로세싱 적용을 위한 함수들 알아보자 (0) | 2022.06.08 |
|---|---|
| [Python] 패키지 구성을 위해 __init__ 파일과 __all__에 대해 알아보자 (0) | 2022.06.06 |
| [Python] 파이썬 패키지란? - package에 대한 설명 및 예시 (0) | 2022.06.05 |
| [Python] 모듈 vs 스크립트 vs 패키지 차이점을 알아보자 (0) | 2022.06.04 |
| [Python] 판다스 apply - 함수에 복수 인자 적용하기 (2) | 2022.03.02 |
| [파이썬] %timeit으로 jupyter notebook에서 Cell 단위 코드 수행 시간 확인하기 (0) | 2022.02.28 |
| [Python] 리스트 요소 곱하기, 배열 원소들끼리 곱하기 (1) | 2022.02.27 |
| [Python] eval() / exec() 함수로 문자열을 파이썬 코드로 실행하기 (1) | 2022.02.26 |
관련된 글 보기
Comments


